
As heat waves become longer, hotter, and more widespread across the planet, human responses to them are becoming increasingly local and specialized.
Both scientific researchers and government officials are finding that the best strategies to keep cool are ones that are specially tailored to a community. That may seem obvious, given that outdoor laborers need different cooling resources than school teachers, for instance. But existing national and regional policies aren’t always that fine tuned—and they run the risk of wasting resources or missing the most vulnerable people.
The stakes are high to address heat effectively. This summer, record-breaking heat waves have swept the northern hemisphere, testing power grid limits in Texas, exacerbating droughts throughout the Southwest, and flaming dangerous wildfires along the Mediterranean. Plus, extreme temperatures are really, really bad for human health. Severe heat causes acute heat exhaustion and heat stroke, while also worsening the risk of chronic conditions ranging from kidney disease to obesity. And as temperatures increase due to climate change, so, too, do the number of people exposed to its effects; the World Health Organization estimates that the number of people who experienced heat waves grew by 125 million between 2000 and 2016.
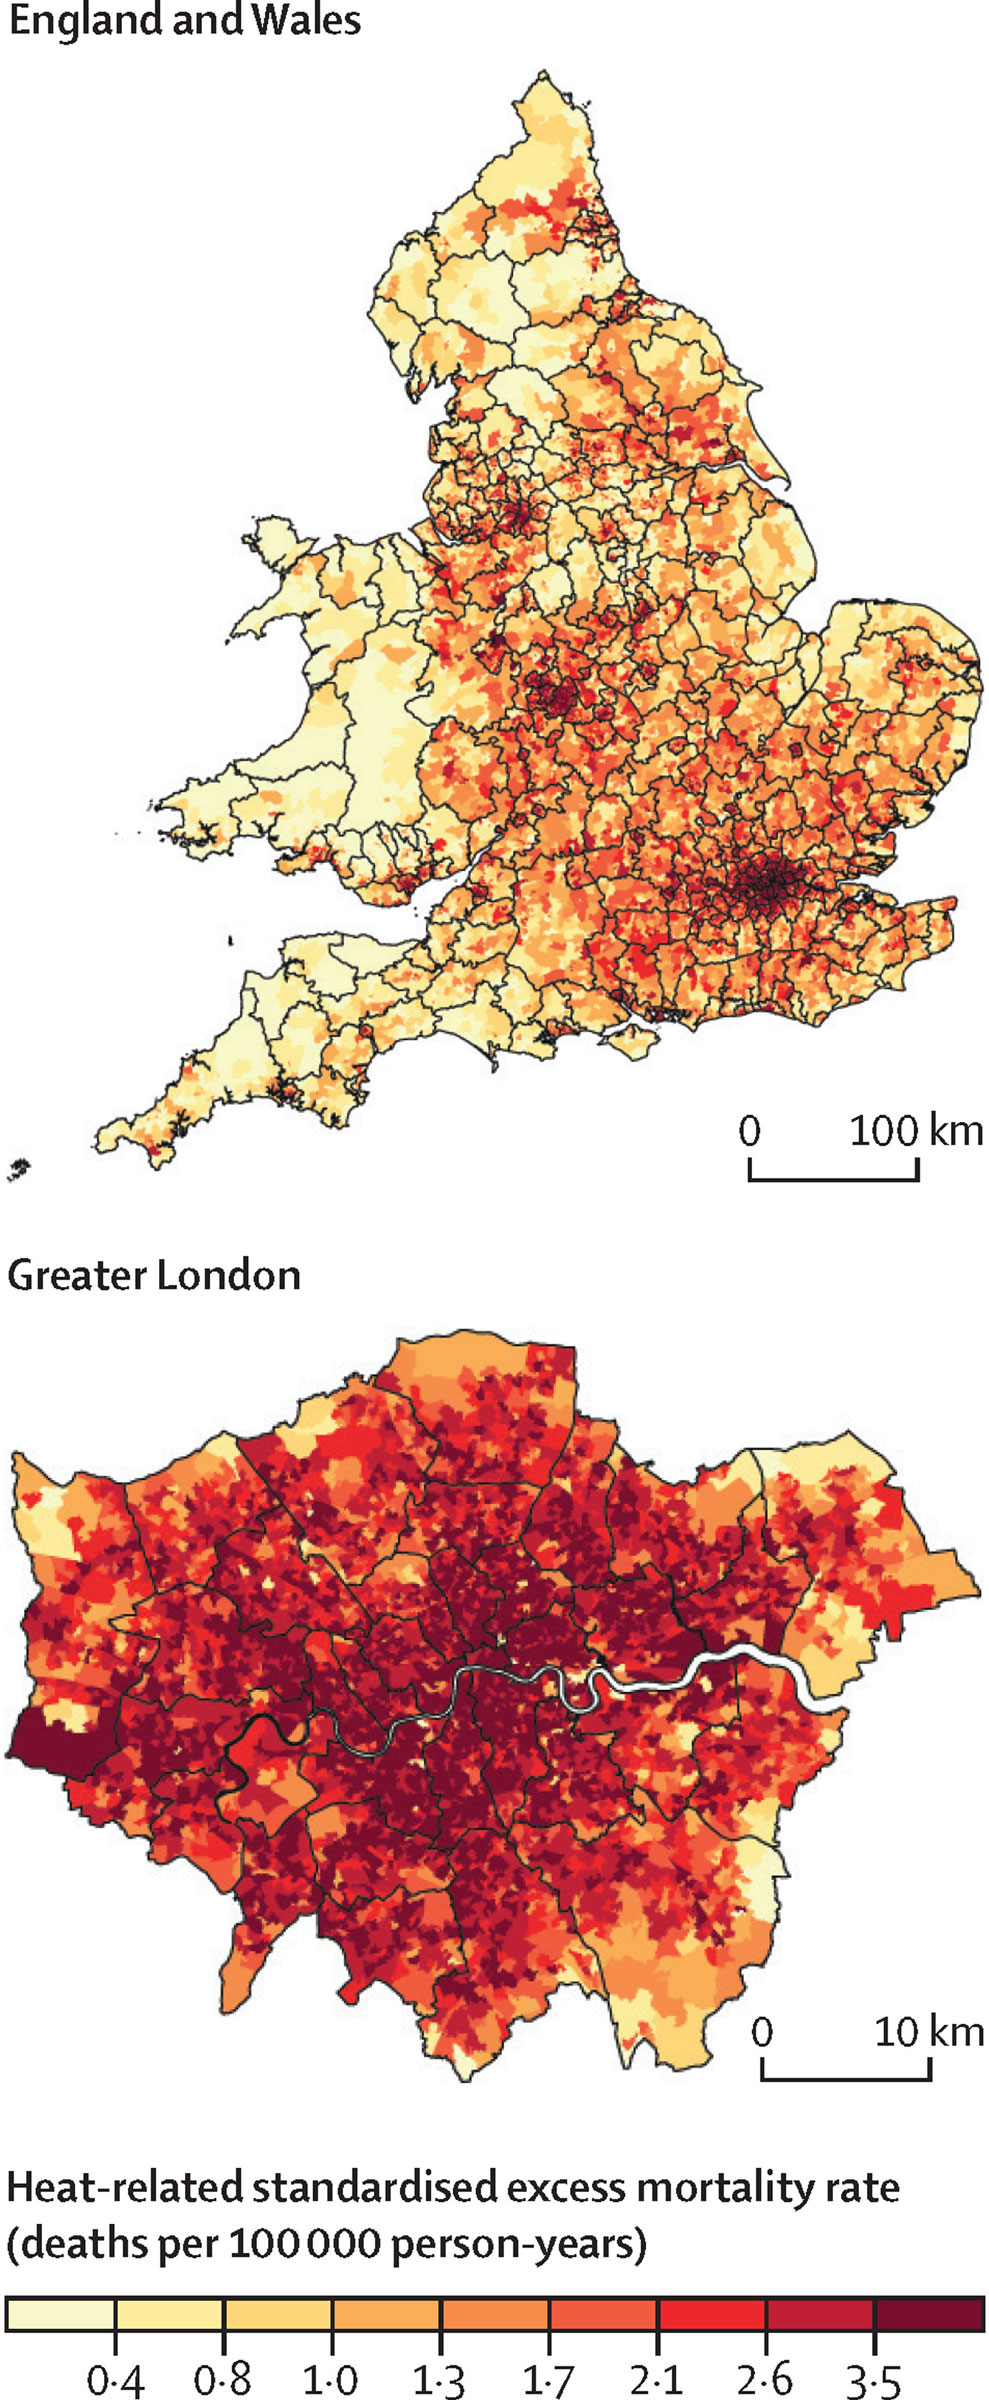
But finding which people are most at risk, and then understanding why their underlying risk factors are higher than others, requires a lot of granular data. Take, for instance, one historical heat study from the U.K.—where, coincidentally, there’s a record-shattering heat wave happening right now—that analyzed temperature-related deaths between 2000 and 2019. London stands well above other areas of England and Wales for population-adjusted rates of excess heat mortality, as the chart below shows, due to the city’s “heat island effect” from the buildings and roads that absorb more heat than greener areas.
The thing is, not all Londoners are equally impacted, and this regional data, although striking, isn’t specific enough to point to the people who most need help. “Vulnerabilities can vary from one neighborhood to another, and city-level analyses tend to smooth everything out,” says Pierre Masselot, an environmental epidemiology research fellow at the London School of Hygiene and Tropical Medicine, who co-authored the study published this month in The Lancet Planetary Health.
Indeed, when the researchers plotted the mortality rates in 35,000 smaller areas across England and Wales, they found that significant differences exist within a region—and even within a city. In London, heat-related deaths ranged from 0.002 to 10.7 per 100,000 person-years (a rate that accounts for all the years in the study) while cold-related deaths ranged from 3.6 to 156 per 100,000 person-years. For the heat mortality, the risk was lowest in a small area within the city’s borough of Islington while the highest was within the borough of Tower Hamlets—an area known for its high immigrant population, where about a third of residents are Bangladeshi according to government statistics.
With that level of specificity in hand, the researchers looked for correlations among 15 different variables, including the socioeconomic makeup of the population (income, age, and population density, for instance) and neighborhood metrics (like age of the buildings, vegetation, and access to housing and community services). Higher heat mortality rates appeared in economically disadvantaged and highly urbanized neighborhoods.
With that data, it’s easier to curate solutions that might range from “warning systems triggered in specific hot or cold periods, to more structural interventions regarding, for instance, urban planning or insulation of buildings,” says the report’s lead author, Antonio Gasparrini, a professor of biostatistics and epidemiology at the London School of Hygiene and Tropical Medicine.
That’s not to say we should get rid of national-level policies. Countries around the globe have imposed work restrictions, employer fines, and other mandates to prevent heat exposure, according to a labor-rules roundup from the Natural Resources Defense Council. In the U.S., the White House kicked off a number of initiatives last September, such as opening cooling centers in school buildings, and developing workplace heat standards and oversight. Those efforts serve a worthy purpose to set national standards.
Read more: 5 Ways the U.K. Is Not Built for Extreme Heat
But programs to upgrade buildings or plant trees in highly urbanized areas have to be targeted for them to pay off. In the U.S., Miami-Dade county is developing initiatives based on very specific data tied to heat-related hospitalizations and emergency department visits by patients’ zip codes. Researchers have layered those hospital record data with heat sensor readings, shrub and tree cover, and the types of pavement in those zip codes to create heat vulnerability maps.
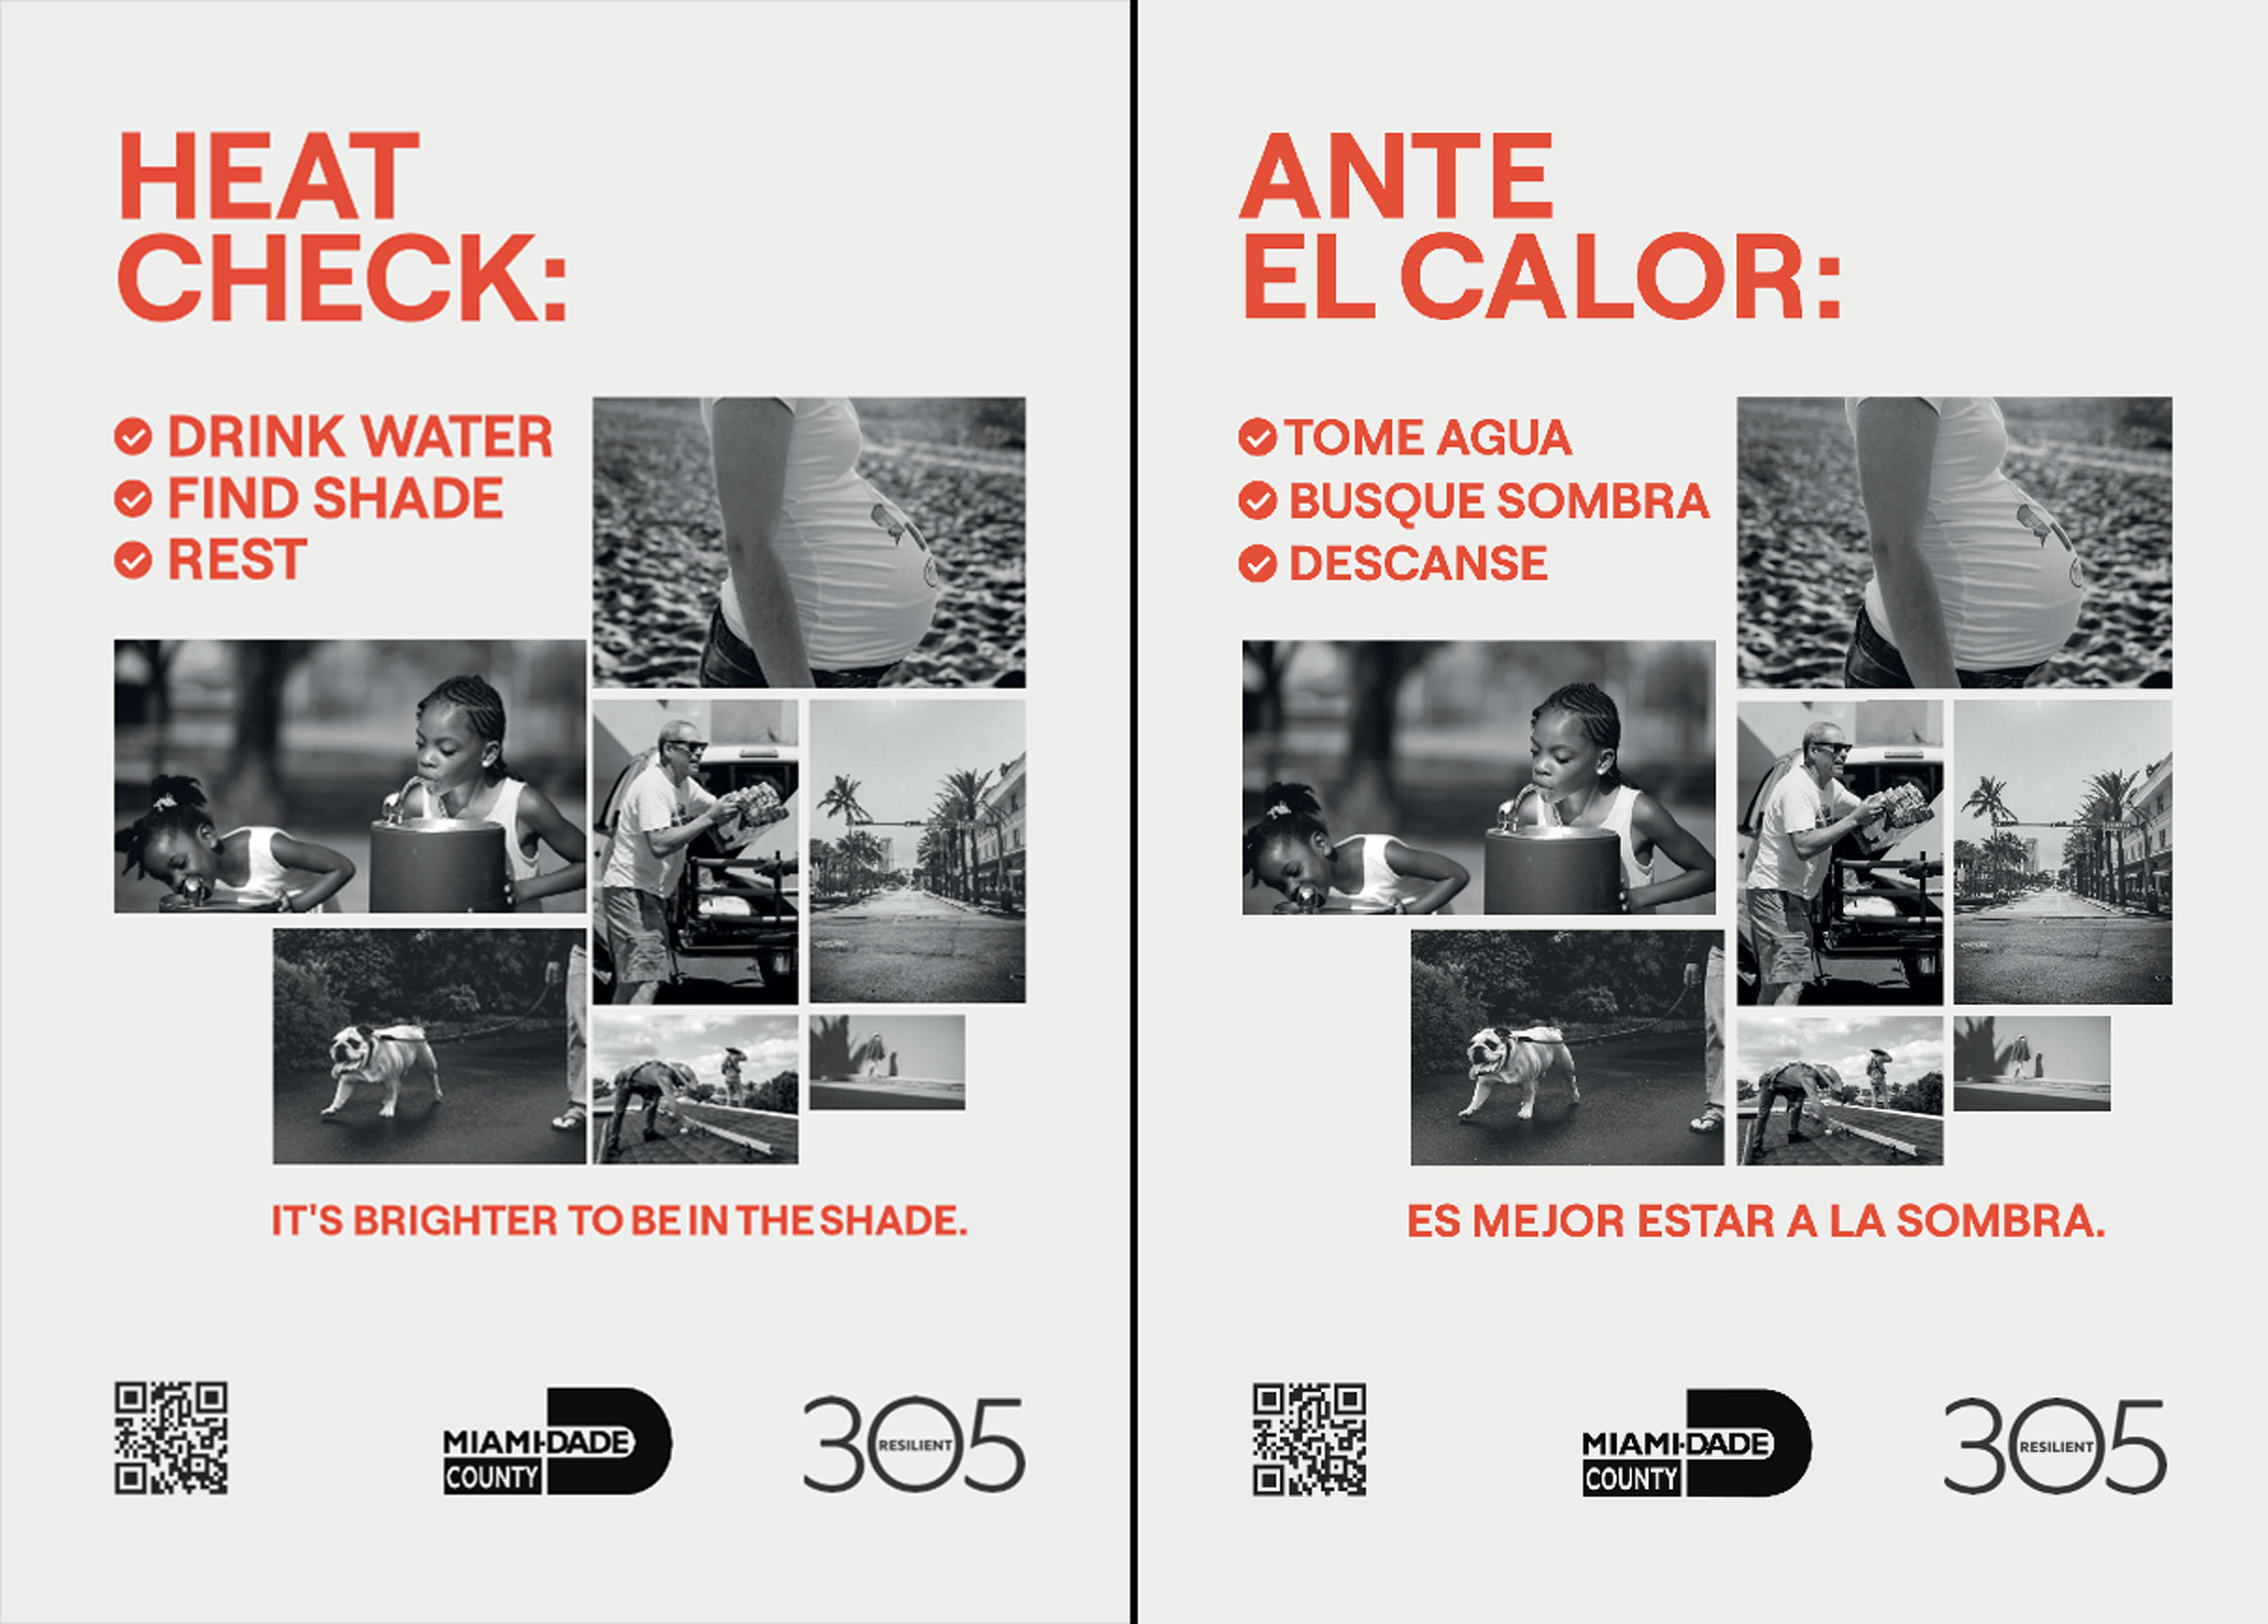
“The things that we found that were highly correlated were a high poverty rate percentage, high land surface temperatures, high percentage of outdoor workers, and, finally, families with children under 18,” says Jane Gilbert, the county’s Chief Heat Officer. “We created a marketing campaign for those demographics in those zip codes.” That education campaign warned people about the adverse effects of extreme heat and listed strategies and resources for keeping cool. The marketing blast included posters at targeted bus shelters and municipal buildings, as well as social media and radio spots.
Just this past weekend, the county once again leveraged its data to distribute 2,700 trees to property owners who were alerted to the giveaway via direct mail. About 2,400 of the trees went to 1,200 households. The rest were donated to nonprofits. “We’re trying to get to 30% tree canopy, but really prioritizing those areas with the highest need,” Gilbert says.
In Phoenix, the city’s Heat Response and Mitigation Office has taken a similar approach. For its tree planting efforts, the city is tapping into data about people’s walking habits. Then, it can target specific streets with the most pedestrians who can benefit from the tree canopy shade. But David Hondula, who heads the department, emphasizes that even hyper local data can fall short, missing, for instance, unsheltered populations that are hard to track. To make sure that there are no blind spots, he says, static data should only be a starting point. The best way for researchers and political offices to understand all the facets heat vulnerability is to engage with the community.
For example, as the city was planning to increase the shaded areas around bus stops, Hondula attended a community meeting where one resident pressed for shade at a stop that Hondula knew was not on any city bus route. “I knew there was no bus stop. I knew it, I was the expert,” he recalls. But as the conversation unfolded, it became apparent that the resident was referring to a bus stop—a school bus stop, not a city bus stop.
“It was outside of our frame of thinking for shade investments. School bus stops are a completely different type of data that we just didn’t have our minds around,” he says. “It was a really clear example of how a community’s understanding of the problem can help shape, and grow, and mature our expert understanding of the problem.”
More Must-Reads From TIME
- The 100 Most Influential People of 2024
- The Revolution of Yulia Navalnaya
- 6 Compliments That Land Every Time
- Stop Looking for Your Forever Home
- If You're Dating Right Now , You're Brave: Column
- The AI That Could Heal a Divided Internet
- Fallout Is a Brilliant Model for the Future of Video Game Adaptations
- Want Weekly Recs on What to Watch, Read, and More? Sign Up for Worth Your Time
Contact us at letters@time.com